I wanted to learn what “AI-ready data” really means in practice, so I built an enrichment pipeline from scratch and stress‑tested it on the EuroShop 2026 exhibitor list. Here’s what broke, what I changed, and what I learned, plus a free dataset you can use for search, rankings, planning, and chatbots.
A 10‑minute problem every retailer recognizes
You’re walking into a vendor meeting at a trade show. Ten minutes to go. You open an “AI assistant” and ask:
“Give me a one‑page brief: what they do, likely strengths, risks/unknowns, and 5 sharp questions, and back it up with evidence.”
If your dataset is just a directory listing, the answer is generic. Worse: the model starts guessing.
So I tried something simple: stop blaming the model… and fix the data.
Why this matters now (retail + agentic AI)
Retail is entering an era where the *interface* to software is no longer a screen — it’s a conversation, an agent, a workflow.
But agentic AI doesn’t run on vibes. It runs on structured facts: consistent fields, reliable evidence, and clear confidence signals.
If you want AI to support real decisions (vendor ranking, expansion planning, rollout risk, investment priority), you need more than “category tags.” You need data you can trust and explain.
I wrote more about the broader retail context in my post “From Raw Retail Data to Agentic AI”.
My experiment: EuroShop’s public exhibitor list
Instead of theorizing, I picked a dataset that’s familiar to everyone in retail tech:
the public exhibitor list for EuroShop 2026.
Goal: turn it into something you can safely use for:
- AI search (semantic + keyword)
- Ranking & shortlists (explainable)
- Predictions & planning (trend signals)
- Chatbot / RAG training (low hallucination risk)
The initial export looks “okay”… until you try to use it as an AI brain.
The first surprise: the dataset is not the problem — the missing context is
A trade‑show directory is optimized for humans scrolling, not for machines reasoning.
In the raw-ish export (in this moment, maybe they will added it later):
- Only 43.5% exhibitors even have a description.
- Only 35.6% have any social link.
- PII is everywhere (emails in 90.5% of entries; phone numbers in nearly all).
- And here’s a fun one: 1327 exhibitors contained a placeholder image fragment inside category text (pure noise).
When you ask an LLM to “analyze” this, it has two choices: be vague — or hallucinate.
So the real task became: create a dataset where the model can stay grounded.
The second surprise: websites are 60–80% junk
If you crawl exhibitor sites, you quickly learn that most text is not product truth:
cookie banners, navigation menus, country dropdowns, footers, job pages, login screens…
That’s why the pipeline needed an aggressive cleaning layer before any extraction.
Otherwise you end up tagging a company as “AI” because their cookie policy says “we use analytics.”
The pipeline (plain English, no hype)
I ended up building a multi‑phase enrichment pipeline:
- Crawl: start from the homepage, then prioritize the pages that usually contain truth (About, Products, Technology).
- Clean: remove boilerplate, menus, cookie text; detect navigation patterns; truncate safely.
- Extract: pull structured fields (what they do, products, capabilities, industries, tech signals) and capture evidence snippets.
- Classify: assign business category, themes, and controlled tags (not free‑form chaos).
- Score: separate truth confidence (how verified) from data richness (how complete) and flag quality issues.
Key design choice: evidence-first. If a field has no evidence, it gets lower confidence — and your AI can be instructed to treat it as a hint, not a fact.
Links to the technical deep dive:
Raw vs AI‑ready: the numbers that actually matter
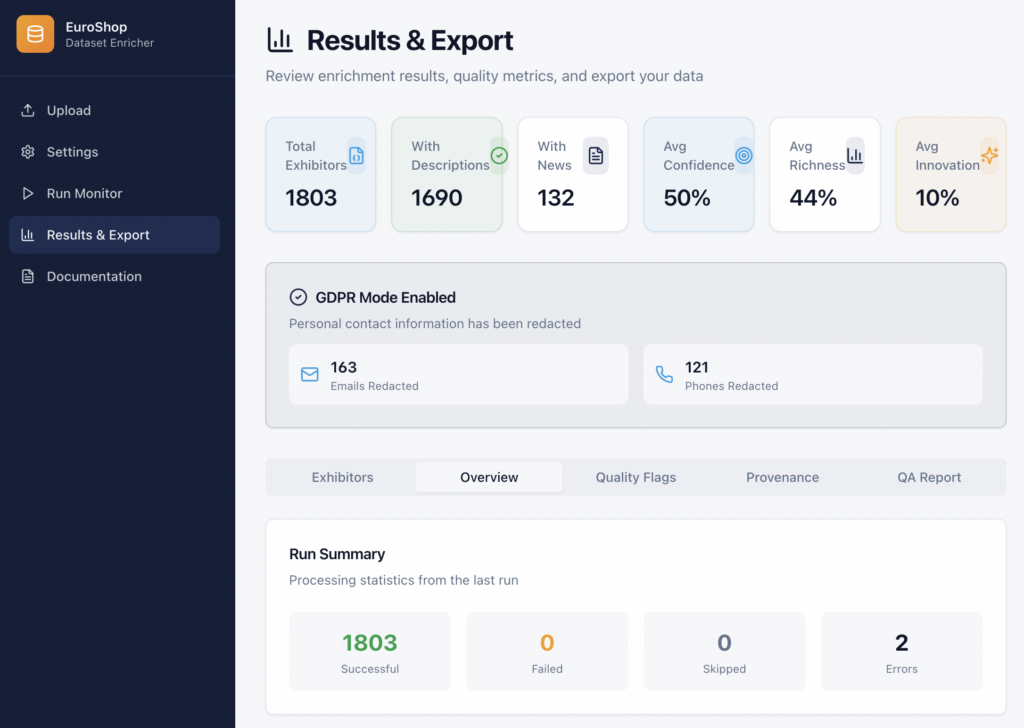
Here’s what changed after enrichment (same 1,803 exhibitors):
| Metric | Original export | AI‑ready export |
| Exhibitors | 1803 | 1803 |
| Countries | 63 | 63 |
| Approx. file size | 8.8 MB (JSON) | 33.4 MB (JSON, AI-ready) |
| Websites present | 1717 (95.2%) | 1717 (95.2%) |
| Descriptions present | 784 (43.5%) | 784 (43.5%) |
| Value proposition generated | — | 1587 (88.0%) |
| Any social link found | 641 (35.6%) | 893 (49.5%) |
| Avg. pages fetched per exhibitor | — | 1.98 (max 3) |
| PII included | Emails: 1632 (90.5%), Phones: 1803 (100.0%) | PII stripped: True (tracked via redaction counts) |
| Avg. tags per exhibitor | — | 2.61 (cap 12) |
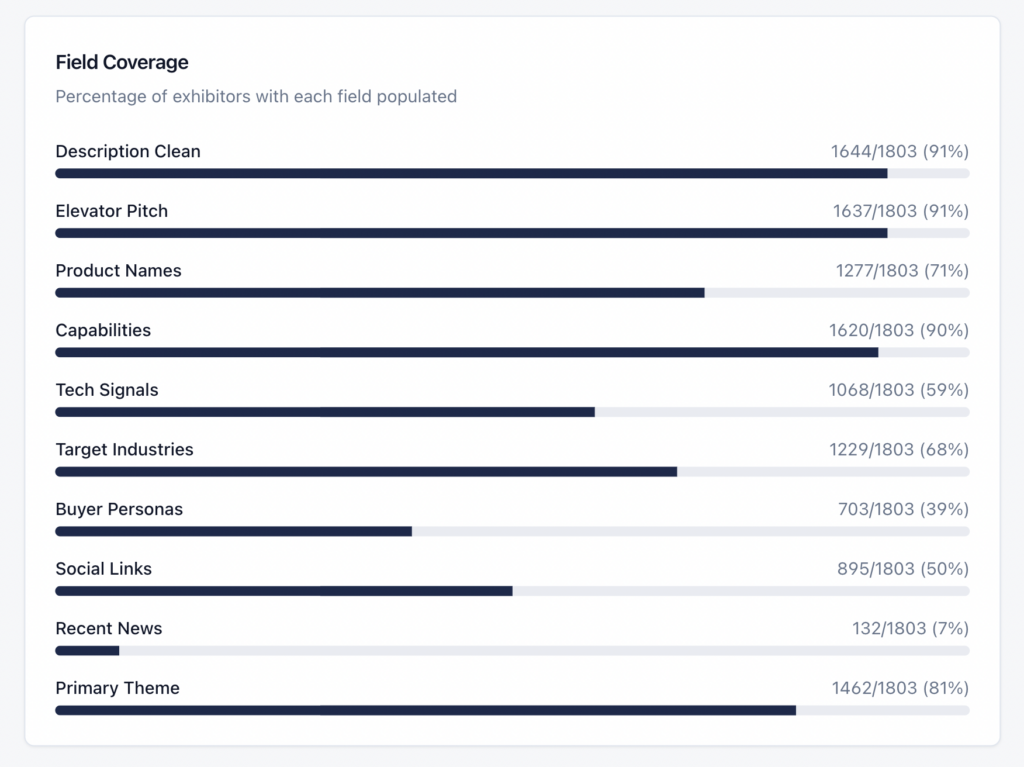
| Data Richness score (median) | — | 47/100 |
| Overall Confidence score (median) | — | 53/100 |
A couple of extra signals that became possible:
- Business categories (distribution): services-other 593, industrial-manufacturing 562, retail-tech 428, storefit-fixtures 220.
- Top themes detected: Sustainability 207, Digital Signage 200, Other 175, Logistics & Supply Chain 137, Store Design & Fixtures 131, Point of Sale 122, Lighting & Energy 119, Payments & Checkout 103.
- Top exhibitor countries: Germany 502, China 236, Italy 154, Netherlands 76, Poland 66.
What you can do with this dataset (real prompts, real value)
Below are examples that go way beyond “show me exhibitors in category X”. They’re designed to save time and reduce bad vendor meetings.
1) The 10‑minute meeting brief
I’m meeting {company_name} in 10 minutes. Create a 1‑page brief: what they do, 3 likely strengths, 3 risks/unknowns, 5 sharp questions, and a recommended next step (demo/pilot/workshop). Use only evidence-backed info from the dataset, and cite the evidence fields.
2) “Edge cases only” vendor shortlist (returns/offline/promos)
My biggest issues: offline transactions, cross‑channel returns, coupon stacking, and fiscal compliance changes. Find exhibitors whose capabilities suggest they can handle these edge cases. For each exhibitor: which edge case they likely handle, what evidence supports it, and what you’d validate live.
3) Build my EuroShop visit plan (who + where + when)
I have 1 day at EuroShop. I care about {themes}. Build an itinerary with 12 exhibitors: morning/afternoon blocks, halls/stands, and 2 goals per meeting. Prioritize high confidence + high richness profiles, but include 2 ‘wildcards’ with strong innovation signals.
4) Create a retailer‑specific top‑20 list
I run 180 fashion stores in 5 countries. Recommend 20 exhibitors for (checkout, loss prevention, ESL, store ops automation). Group them by problem. For each, give a 2‑line fit summary, key capabilities, and 3 questions that expose integration and operational risks.
5) Vendor risk radar (what the dataset cannot prove)
For the top 30 exhibitors by innovation_score, list the top 5 unknowns you would validate before a pilot (integration, support model, certifications, regional readiness, references). Use data_quality_flags and confidence scores to justify each unknown.
6) Competitive landscape map
Cluster exhibitors into 8–12 clusters based on themes + tech signals. For each cluster, describe the ‘battlefield’ (what they compete on), typical buyer persona, and what’s changing right now.
7) Find partners, not vendors (for POS / platform providers)
I’m a POS platform vendor. Identify exhibitors that look like strong partnership targets (complementary tech, integration-friendly, clear value proposition). Give 10 targets, the partnership angle, and the evidence behind it.
8) “Explainable ranking” for a decision meeting
Rank exhibitors for {use_case} using a weighted approach: 40% capability fit, 25% confidence, 20% evidence quality, 15% innovation signals. Output the score breakdown and the evidence lines used. No guesses.
How to use it safely (so your AI doesn’t overpromise)
A few rules I recommend when you plug this into an LLM, search engine, or agent:
- Treat low‑confidence fields as hypotheses — not truth.
- Prefer evidence-backed fields (snippets/sources) when generating recommendations.
- Use data_quality_flags to avoid ranking errors (e.g., no_pages_fetched, listing_based_extraction).
- Keep the OPS dataset separate from AI-ready exports (PII vs non‑PII).
- For prediction: never train on one signal; combine themes + capabilities + evidence + market context.
What I learned (the part nobody tells you)
- Enrichment is less about ‘more data’ and more about better structure.
- Controlled vocabularies beat free-form tags. Otherwise your embeddings become a junkyard.
- Separating product technology from website stack prevents embarrassing false positives.
- Two scores matter: truth confidence (trust) and data richness (coverage). Don’t mix them.
- Quality flags are not negative — they’re what makes the dataset usable for serious AI.
Want the dataset?
I’m sharing the AI‑ready enriched dataset for EuroShop exhibitors for free (link in my newsletter).
If you’re a retailer, it helps you plan meetings and cut through noise.
If you’re a POS vendor or solution provider, it helps you map the ecosystem, find partners, and spot themes early.
And if you’re building agentic AI in retail: this is a practical example of how to keep LLMs grounded.