


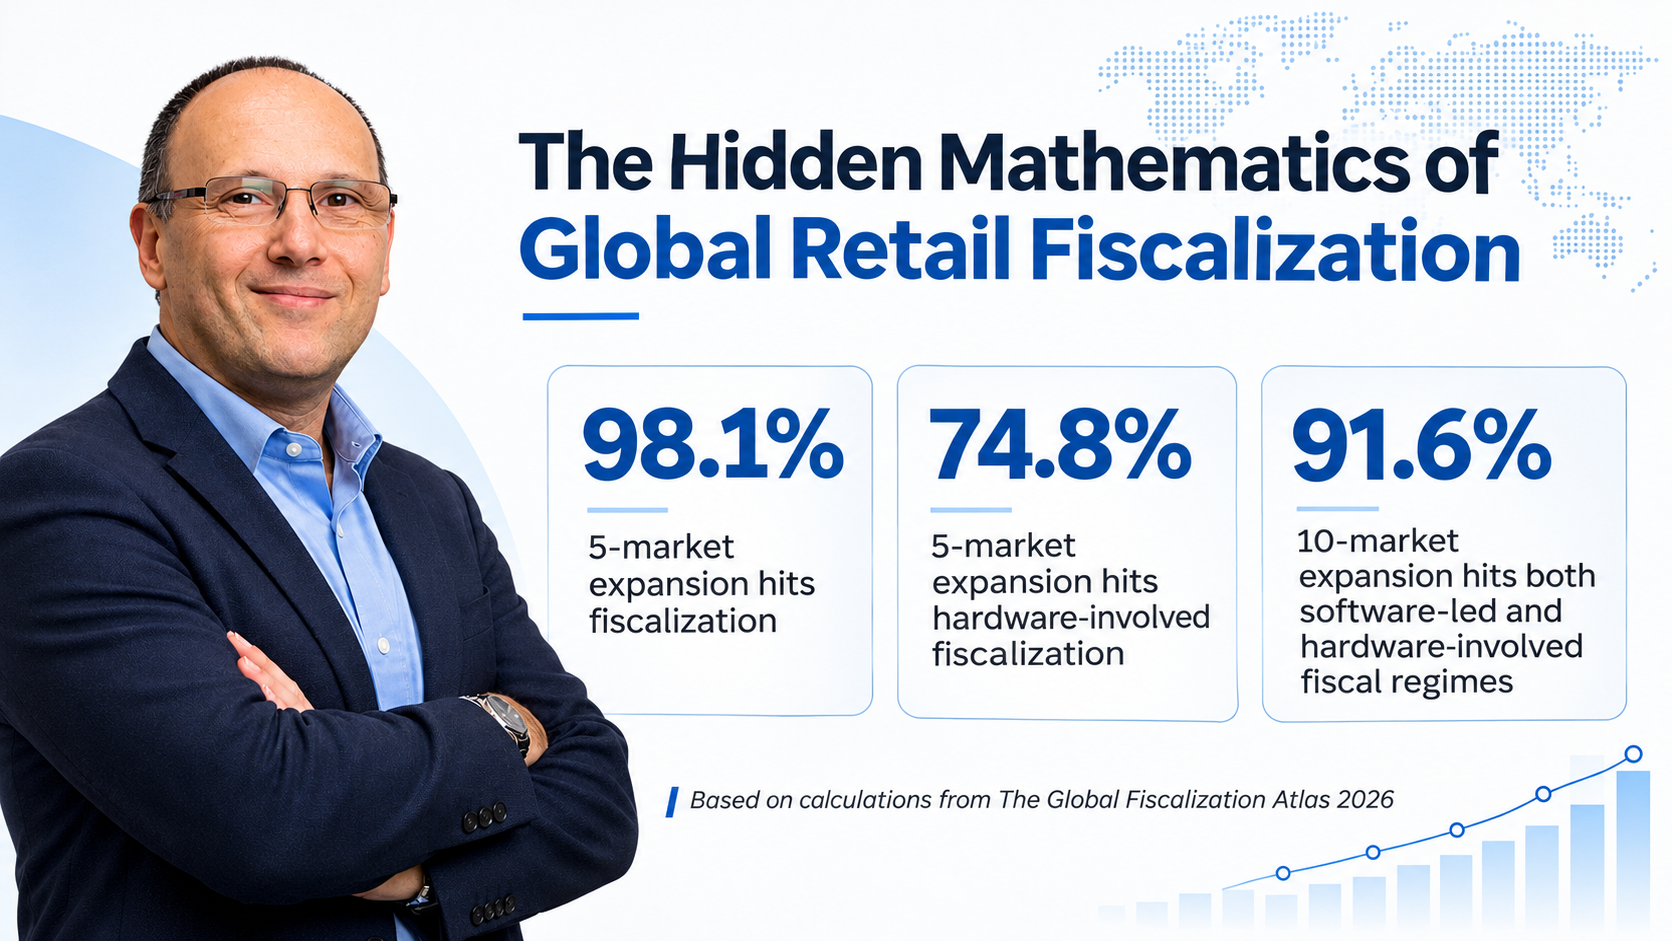
A probability model based on 197 countries and jurisdictions reveals why international retail expansion almost inevitably leads to implementation of fiscal laws, often through a combination of software, connected reporting, and dedicated hardware.
RESEARCH SUMMARY
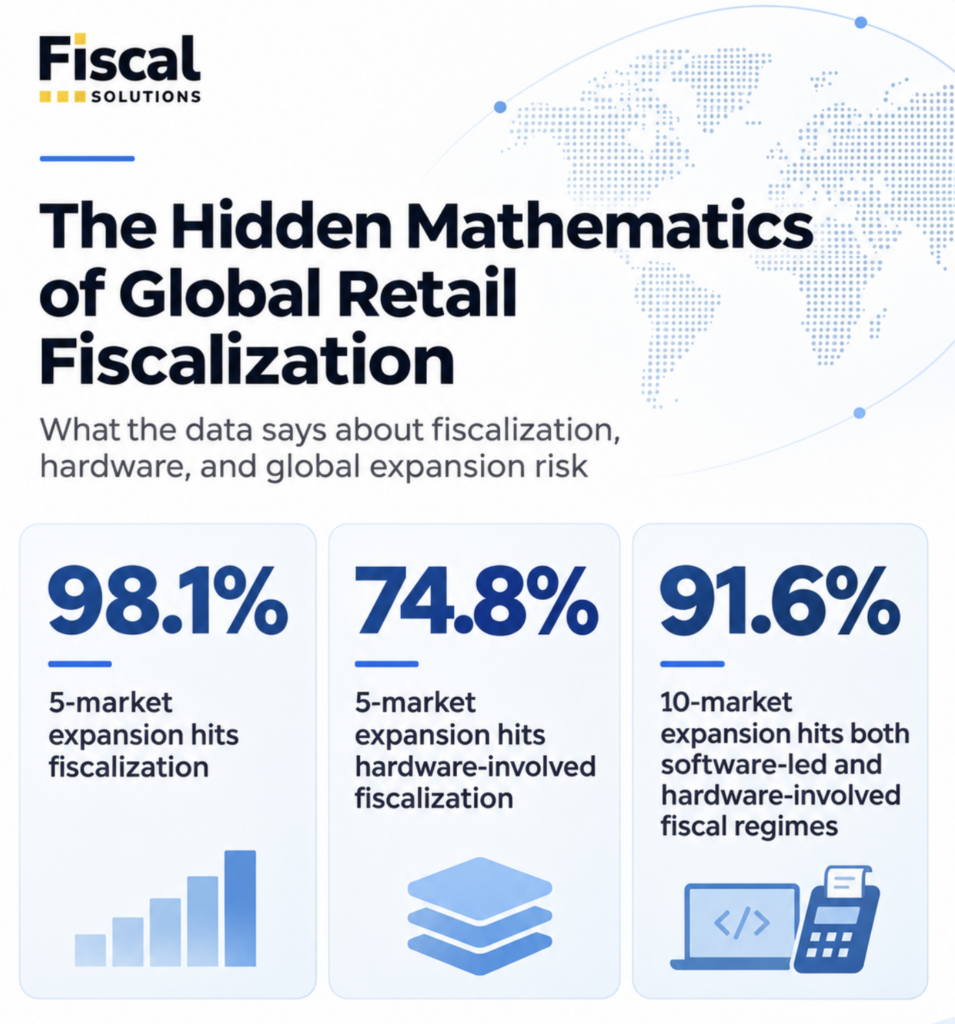
A retailer entering five different markets faces a 98.1% probability of encountering a clearly fiscal jurisdiction and a 74.8% probability of encountering at least one hardware-involved fiscal regime.
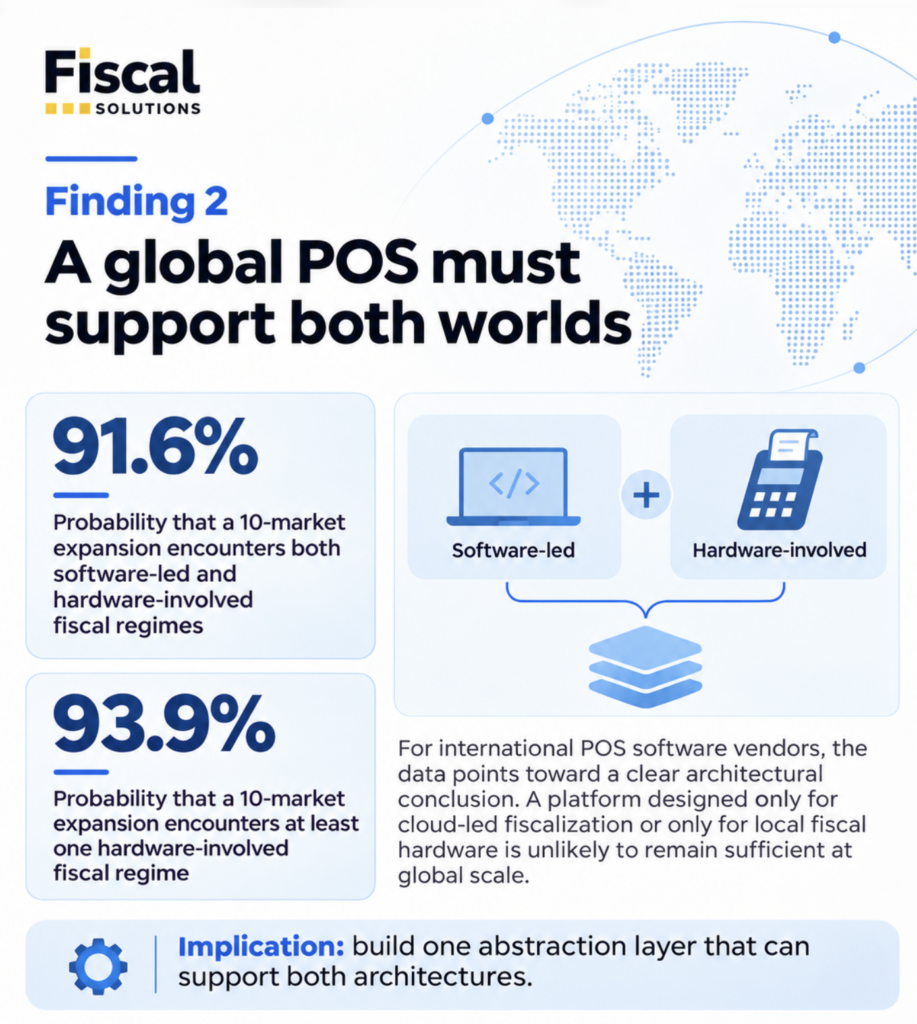
Across ten markets, the probability of encountering both software-led and hardware-involved fiscal architectures rises to 91.6%, while the chance of encountering a real-time or near-real-time reporting signal reaches 94.7%.
Europe presents a particularly concentrated hardware challenge: a five-market European expansion has a 98.1% modeled chance of including a jurisdiction with hardware involvement, even though South America has the higher overall fiscalization density. These figures describe exposure under an equal-market statistical model, not a forecast for any particular retailer; the commercial implication is that fiscalization belongs in the architecture of internationally oriented POS systems from the outset.
The global retailer has always faced an uncomfortable contradiction. Its commercial ambition is to make stores, channels, payments, and customer experiences consistent across borders, while tax administrations continue to define the evidence of a legally valid sale differently from one jurisdiction to another. In an era when technology companies promise a single commerce platform for the world, the regulatory architecture behind each transaction remains strikingly local.
The Global Fiscalization Atlas 2026 makes that contradiction measurable. Its normalized dataset covers 197 countries and jurisdictions, including 107 clearly fiscal markets, 85 non-fiscal markets, and five cases deliberately kept outside a simple binary classification. The book describes the technologies, regional patterns, and operational consequences of fiscal control, but the underlying counts also permit a new line of inquiry: the probability that a retailer or POS software provider will encounter particular types of compliance obligations as its international footprint expands.
Using those counts, I constructed a finite-population probability model that estimates the likelihood of encountering fiscalization, hardware-based control, software-led architectures, near-real-time reporting, and the more complex regulatory environments described in the Atlas. The result is not a precise forecast of where a particular retailer will open its next store; it is a revealing measure of how quickly apparently local requirements become a structural feature of international retail technology.
The denominator matters more than the headline
The Atlas classifies 107 of 197 analysed markets as clearly fiscal, a global rate of 54.3%. Hardware is involved in 47 of those 107 fiscal markets, including 31 hybrid hardware-and-software regimes and 16 primarily hardware-based regimes, while software is a material component in 91 fiscal markets. These figures are sometimes easy to misinterpret because they are calculated against different populations.
A uniformly selected jurisdiction has a 54.3% probability of being clearly fiscal and a 23.9% probability of being both fiscal and hardware-involved. Once a selected jurisdiction is known to be fiscal, the conditional probability of hardware involvement increases to 43.9%. Hardware involvement does not necessarily mean that every transaction requires a fiscal printer, and the Atlas’s primary architecture categories should not be confused with an exhaustive inventory of every legal obligation within each country.
| Atlas classification | Market count | Share of all 197 | Share of 107 fiscal |
| Clearly fiscal | 107 | 54.3% | 100.0% |
| Software-based or online/real-time | 60 | 30.5% | 56.1% |
| Hybrid or primarily hardware-based | 47 | 23.9% | 43.9% |
| Primarily hardware-based | 16 | 8.1% | 15.0% |
| Transition, partial, or mixed | 5 | 2.5% | Not classified as clearly fiscal |
Table 1. The fiscal categories are derived from Atlas Chapters 1 and 4 and Appendix A; the final row is deliberately not absorbed into the clearly fiscal denominator. Source: Pavic, 2026, pp. 19, 29, 68–69.
From a local rule to an almost certain exposure
To model an international rollout, I assume that a company enters n distinct markets selected uniformly from the 197 jurisdictions in the Atlas, without selecting the same market twice. If K markets possess a characteristic, the probability that the company encounters at least one such market is the complement of the probability that every selected market comes from the remaining 197 − K markets.
P(at least one exposure) = 1 − C(197 − K, n) / C(197, n)
Here C(a, b) denotes the number of ways to select b distinct items from a, and the calculation is exact for the stated model rather than an approximation based on independent draws. The distinction is small for short expansion lists but conceptually important, because a retailer cannot open two different countries by choosing the same country twice.
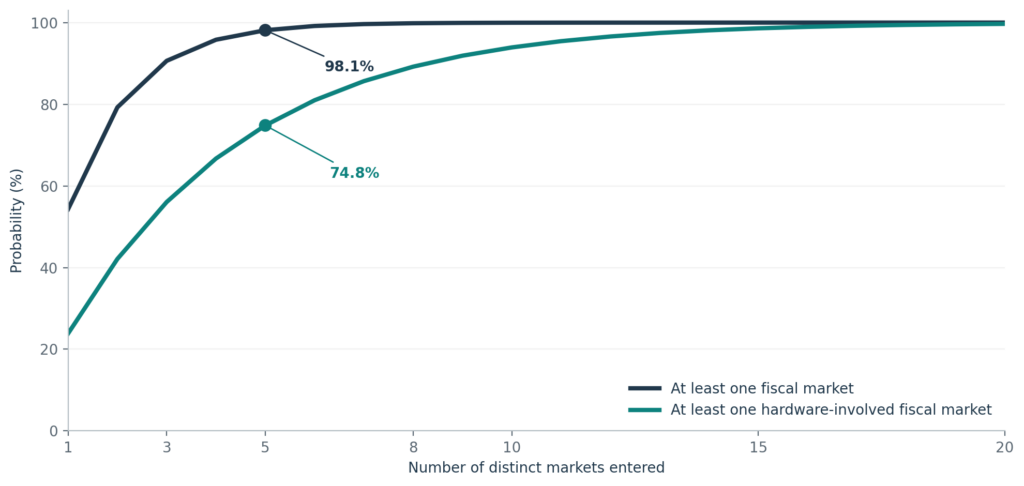
Figure 1. Probability of encountering at least one clearly fiscal market or hardware-involved fiscal regime as a uniformly selected international footprint expands. Original calculations from Atlas counts; markets are sampled without replacement.
| Distinct markets entered | At least one fiscal market | At least one hardware-involved market |
| 1 | 54.3% | 23.9% |
| 2 | 79.3% | 42.1% |
| 3 | 90.6% | 56.1% |
| 5 | 98.1% | 74.8% |
| 10 | 99.97% | 93.9% |
| 15 | >99.99% | 98.6% |
| 20 | >99.99% | 99.7% |
Table 2. The rounded probabilities arise directly from the Atlas counts and are not retailer-specific compliance forecasts.
The probability of encountering a clearly fiscal market crosses 90% with only three distinct market entries and reaches 98.1% with five. At ten markets it stands at 99.97%, which makes the assumption that fiscalization will remain an occasional local exception difficult to defend for a globally oriented POS product. The hardware exposure curve rises more slowly but is no less consequential, reaching 74.8% across five markets, 93.9% across ten, and 99.7% across twenty.
These are probabilities of exposure at the jurisdiction-classification level. A retailer’s legal obligations depend additionally on business sector, transaction type, taxable entity, payment method, local exemptions, and operational model; a retailer that chooses markets strategically rather than uniformly will therefore face a different probability distribution, even though the underlying structural fragmentation remains.
The real architectural collision is between software and hardware
The more consequential finding may be the likelihood of encountering two fundamentally different fiscalization architectures within a single retail technology portfolio. Of the 107 clearly fiscal markets, 60 are classified as software-based or online/real-time software, while 47 are classified as hybrid or primarily hardware-based. These groups are disjoint under the Atlas’s primary-architecture taxonomy, although technical device signals can still appear in a software-led jurisdiction.
The probability of encountering at least one market in each group is 32.0% after three entries, 60.8% after five, and 91.6% after ten. This calculation uses the inclusion–exclusion principle, which subtracts portfolios containing no software-led market and those containing no hardware-involved market, then adds back portfolios that contain neither group.
P(both types) = 1 − C(137,n)/C(197,n) − C(150,n)/C(197,n) + C(90,n)/C(197,n)
The practical message is that a POS vendor targeting a ten-country footprint is statistically very likely, under the model, to confront both software-first fiscal transactions and hardware-dependent fiscal processes. A product built only around a cloud API may therefore require local device integration, while a product developed around an old fiscal-printer interface may prove poorly suited to online authority clearance, structured electronic documents, and server-side security controls.
The need is not for an artificial global fiscal standard but for an architecture that separates commercial transaction creation from country-specific fiscal execution. Transaction data, taxation, identity, security, receipt evidence, reporting, recovery, and auditability should form an explicit integration contract, while jurisdiction-specific adapters enforce the applicable national rules without requiring the entire POS transaction flow to be redesigned.
Europe offers a concentrated hardware challenge
The global average conceals substantial regional differences. South America has the highest fiscalization rate in the Atlas, with ten clearly fiscal markets among twelve analysed jurisdictions, while Europe has 32 among 46. Yet Europe contains 24 hardware-involved fiscal jurisdictions, corresponding to 75.0% of its fiscal markets and more than half of all hardware-involved fiscal markets in the entire Atlas.
When the same five-market expansion model is applied separately within each region, hardware involvement becomes an almost certain exposure in Europe. The probability reaches 98.1%, compared with 70.7% in Asia, 68.2% in South America, and 56.7% in Africa; North America records no hardware-involved regime under the Atlas’s clearly fiscal primary-architecture categories, though that classification must not be mistaken for the absence of subnational or other device obligations.
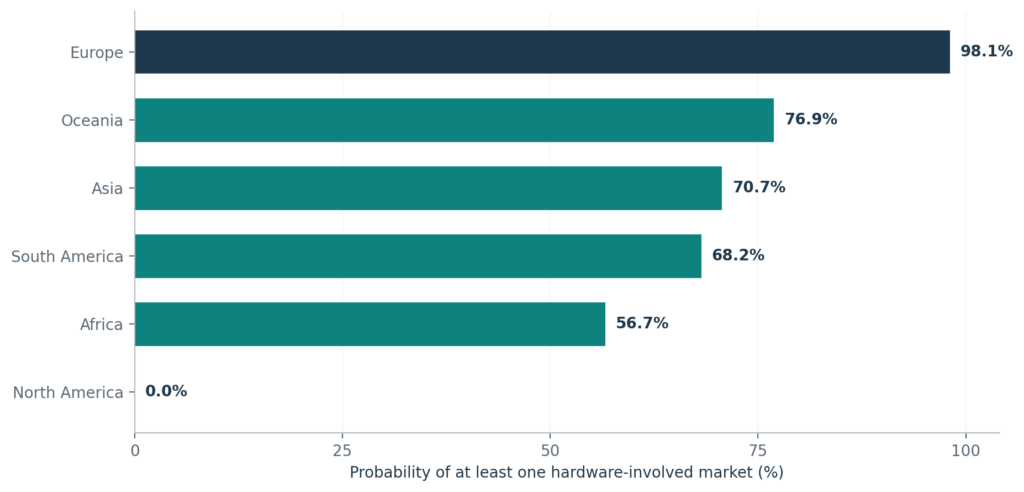
Figure 2. The probability that five uniformly selected distinct markets within a region include at least one hardware-involved fiscal regime. Based on the regional population and architecture counts in Atlas Appendix A, p. 68.
The difference has direct implications for retail deployment. A company expanding across South American markets should prepare for structured electronic tax documents, authority communication, digital signatures, and reporting pipelines. A company expanding across Europe is more likely to need those capabilities alongside device life-cycle management, hardware integration, installation logistics, local certification, and store-level incident handling. Neither architecture is intrinsically easier; each concentrates operational risk in different places.
Fiscal hardware persists even when the primary control moves to software
The Atlas identifies 16 clearly fiscal markets in which dedicated hardware remains the primary control point. In the equal-market model, the probability of encountering at least one such market is 34.8% over five markets, 58.0% over ten, and 83.2% over twenty. These probabilities are narrower than the broader hardware-involvement measure because hybrid regimes are excluded, but they matter to software vendors that intend to operate entirely through browser-based checkout interfaces or cloud services.
The statistical distinction also shows why the phrase “fiscal hardware” requires precision. The Atlas records 47 hardware-involved primary architectures, but only ten country narratives explicitly identify a fiscal printer and eleven explicitly mention a security module or control unit. Such feature counts are indicators of what the source narratives mention, not an exhaustive legal catalogue; a missing feature signal cannot be used to conclude that the corresponding requirement does not exist.
For a retailer, the relevant operational question is therefore not simply whether the platform connects to a printer. It is whether the entire device or security-component lifecycle can be governed, including registration where applicable, certificate or key management, firmware compatibility, local connectivity, replacement, transaction recovery, and the preservation of evidence after a component fails.
More controls do not necessarily mean more hardware
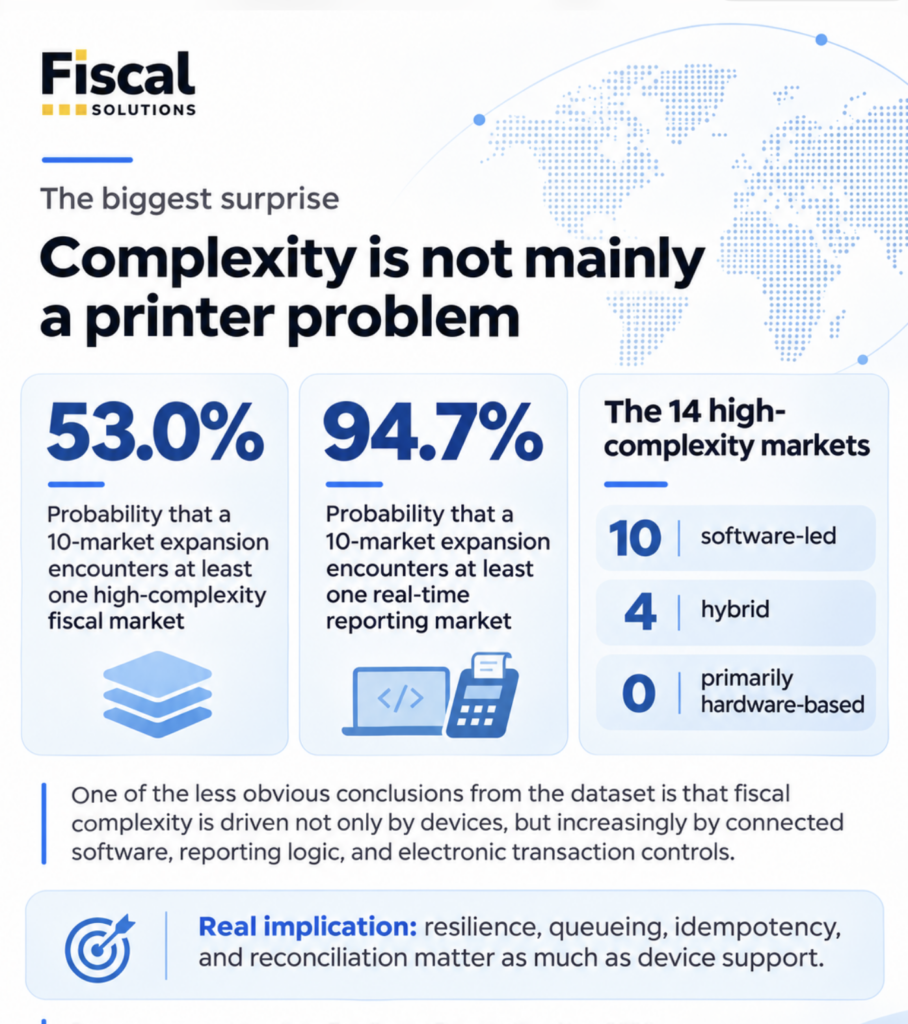
A second inference from the Atlas challenges the assumption that the most difficult fiscal regimes are necessarily those built around dedicated devices. Among the 14 markets assigned to the high indicative-complexity band, nine are primarily software-based, one is online/real-time software, and four are hybrid. None is classified as primarily hardware-based. This conclusion follows from a new cross-tabulation of the country-level records in Appendix B rather than from a statistical table already presented in the book.
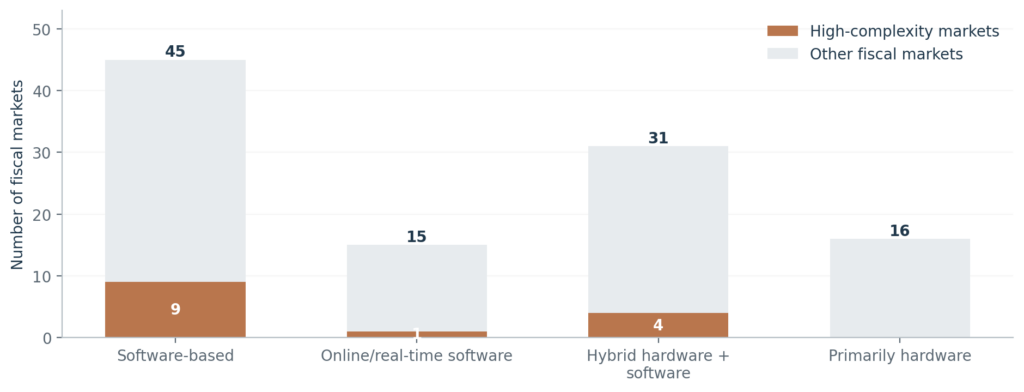
Figure 3. New cross-tabulation of the Atlas’s 14 high indicative-complexity markets against the four primary architecture families. Source: Appendix B, pp. 70–76.
This observation must be interpreted carefully. The complexity indicator is a count of identified technical features, such as real-time reporting, QR codes, digital signatures, security modules, certified software, and offline procedures; it is not an estimate of labor hours, certification costs, legal uncertainty, or implementation expense. The result nevertheless supports an important research hypothesis: connected software, structured document requirements, and interactions among different fiscal controls may account for as much practical integration complexity as dedicated devices.
The geographical distribution is equally notable. Seven of the 14 high-scoring jurisdictions are in Africa, two in Europe, two in South America, and one each in Asia, North America, and Oceania. Within the clearly fiscal population, that corresponds to 22.6% of African markets compared with 6.3% of European markets, although small samples and differences in the narrative detail underlying each score limit comparisons.
A ten-market portfolio has a 53.0% modeled probability of encountering at least one high-complexity jurisdiction, rising to 78.9% across twenty markets. For POS vendors, the practical response is to validate entire business processes, including returns, voids, advance payments, connectivity failures, and transaction recovery, rather than equating a successful initial sale with compliant system behavior.
Connected control changes the scale of operational failure
The Atlas identifies real-time or near-real-time reporting in 49 clearly fiscal markets, corresponding to 45.8% of the fiscal population and 24.9% of all analysed jurisdictions. The probability of encountering at least one such reporting environment reaches 76.5% in a five-market expansion and 94.7% in a ten-market expansion. That makes real-time fiscal connectivity a mainstream design condition for international commerce systems under the model, not a rare edge case.
The shift also changes the location of risk. A local fiscal printer failure may interrupt one checkout, while a centralized certificate, message queue, authority endpoint, or fiscal orchestration service may affect many lanes, an entire retailer, or a national operation. The resulting system requires more than a stable API connection; it requires explicit transaction states, durable delivery, idempotent retries, outage behavior aligned with local law, reconciliation, observability, and a reconstructable chain of fiscal evidence.
The Atlas also identifies e-invoicing linkages in 43 fiscal markets, QR codes in 37, and digital signatures in 26. The dataset does not provide all co-occurrences needed to claim how frequently these features must appear together within one country, yet it clearly demonstrates why a transaction system cannot treat payment, commercial invoice, fiscal receipt, authority acknowledgement, and retained audit record as interchangeable objects.
What ten countries are likely to demand from a POS portfolio
Probability describes the chance of encountering at least one requirement, but budget planning also benefits from expected counts. For each characteristic identified in K of the 197 jurisdictions, the expected number of exposed markets in a uniformly selected ten-country portfolio is 10K/197, regardless of whether the country selections are independent.
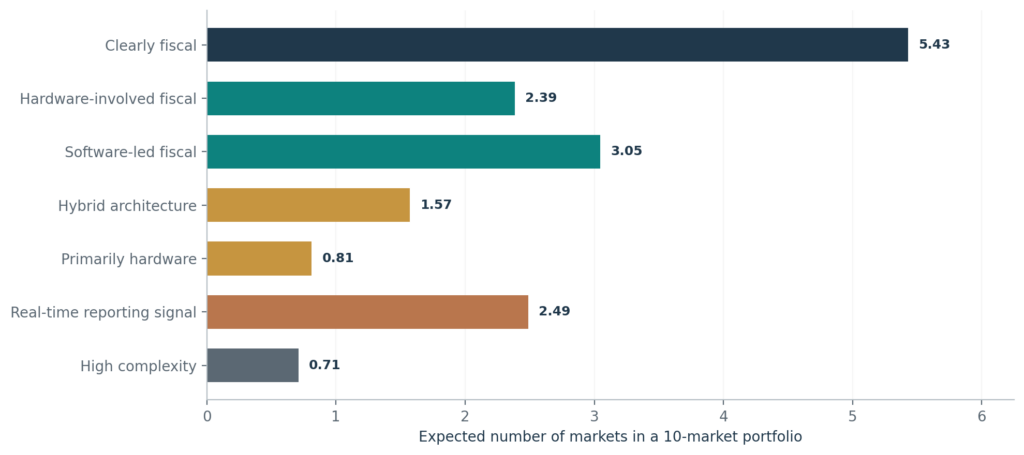
Figure 4. Expected number of markets with selected fiscal features in a uniformly selected ten-market portfolio. Rows overlap; categories should not be summed. Original calculations from Atlas Appendix A.
Such a portfolio would contain, on average, 5.43 clearly fiscal markets, including 3.05 software-led fiscal markets and 2.39 hardware-involved markets, with approximately 2.49 markets carrying an identified real-time reporting signal. The same portfolio would contain 0.71 high indicative-complexity markets on average, although the chance of encountering at least one high-complexity market would be 53.0%. The expected value and the at-least-one probability answer different questions and should not be confused in procurement or resource planning.
A further calculation indicates that a ten-market portfolio has a 21.5% probability of including all four primary fiscal architecture families, increasing to 64.7% for twenty markets. A global platform therefore needs to support different execution models even if its first releases happen to encounter only one or two of them.
A separate gap is forming in machine-readable compliance knowledge
Fiscal technology is only one part of the expansion challenge. The Atlas marks 36 of 107 clearly fiscal markets as covered by Fiscal Portal, leaving 71 outside that specific knowledge base at the time of the July 2026 research snapshot. Under the same statistical selection model, the chance of encountering at least one clearly fiscal market not covered by Fiscal Portal is 89.6% across five markets and 99.0% across ten.
This is a coverage statistic for one research service, not proof that regulatory information is absent, unavailable to competitors, or unknowable. It nevertheless reveals the size of a potential task for structured legal research, country-specific specifications, integration testing, automated change monitoring, and the reliable use of AI in compliance engineering. The gap is especially pronounced in the 45 software-based fiscal markets, of which eight were marked as covered, compared with eight of the 16 primarily hardware-based markets.
For software vendors, documentation is becoming part of product architecture. A well-governed fiscal integration requires not merely prose describing local law but explicit identifiers, document schemas, state transitions, validation rules, negative scenarios, and test evidence that developers and, increasingly, AI-assisted development systems can use without guessing at requirements that must be deterministic.
The economics of the next international POS platform
The numbers change the way I would assess the costs of global POS development. A retailer or POS software company can still build a country-specific fiscal integration, and for a single market that may remain an entirely reasonable commercial decision. But once the portfolio extends to five or ten countries, repeated local customization becomes increasingly likely to accumulate duplicated logic, inconsistent transaction records, certification dependencies, and costly regression testing.
A more durable model separates a stable commercial transaction core from a governed fiscalization layer capable of mapping each sale, return, cancellation, or correction to the applicable national execution model. That layer should preserve the relationship among original transaction data, tax treatment, device or software evidence, government acknowledgements, final customer documents, and the complete audit history, without assuming that any one market’s process is globally representative.
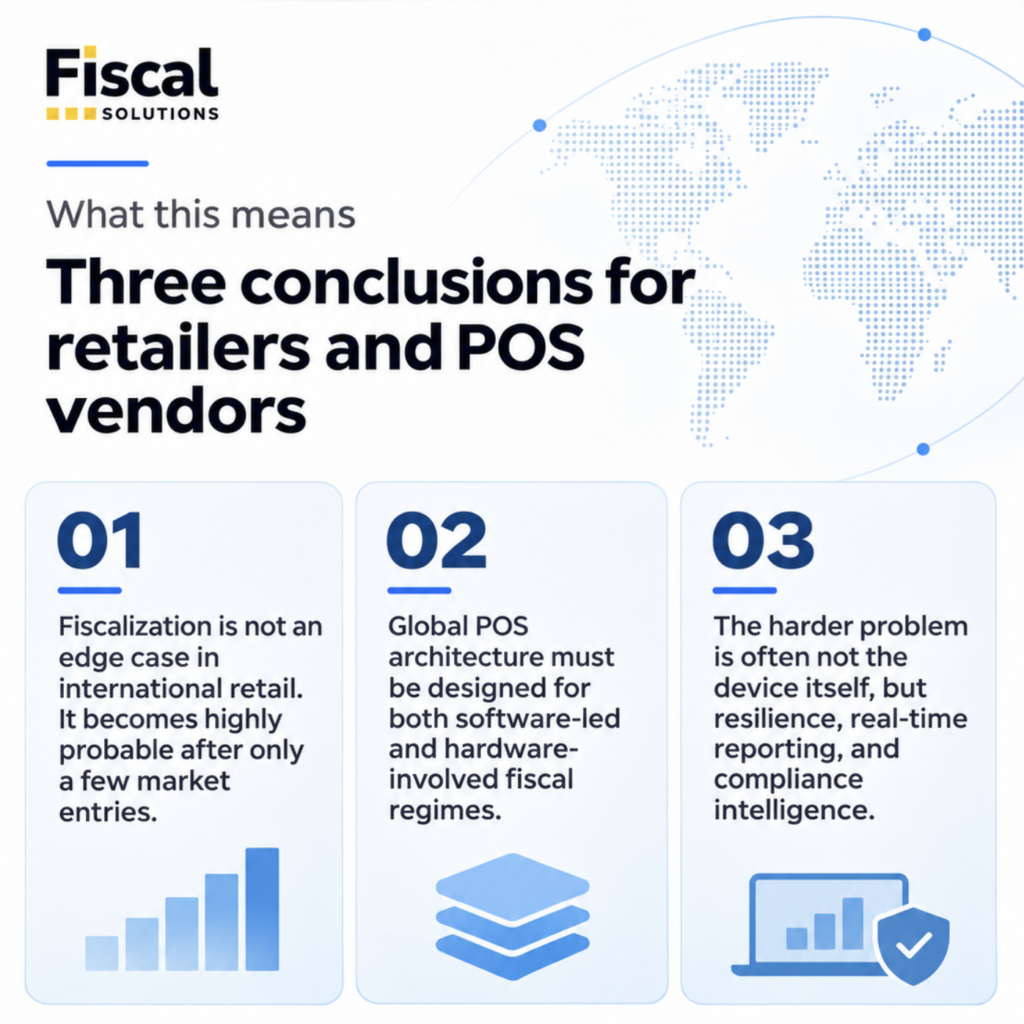
This architectural conclusion is consistent with the Atlas’s primary thesis, but the new probability calculations give it a different commercial force. Fiscalization ceases to be an occasional line item in international expansion budgets and becomes a recurring infrastructure requirement whose probability can be estimated before the choice of target country is even known.
What the probability model does not claim
The model assumes that each of the 197 markets is equally likely to be selected, that each market is entered only once, and that the Atlas’s July 2026 classifications are used without projecting subsequent legal reforms. These assumptions are intentionally simple and transparent, but actual retailers select markets according to economic attractiveness, geographic proximity, competitive position, supply chains, and their own operating model. A population-weighted, GDP-weighted, or retailer-specific market-selection model could produce materially different results.
The Atlas also distinguishes 107 clearly fiscal markets from three transition or planned markets, one partial or limited case, and one mixed jurisdiction. For comparability, this analysis includes those five special cases in the 197-market universe but not in the 107 clearly fiscal count. Treating them differently, or updating particular country statuses following legislative changes after July 2026, would change the resulting probabilities.
Most importantly, an architecture classification is not itself a legal conclusion about every store, checkout, or transaction. Some requirements apply only to specific taxpayer categories or business activities; conversely, a country classified as non-fiscal in the Atlas can still impose substantial invoicing, recordkeeping, payment, consumer, and tax reporting obligations. The model measures the distribution of classified fiscal-control regimes, not the probability that a particular retailer will violate the law or incur a particular integration cost.
Fiscalization is becoming a design certainty
The significance of these calculations lies in how quickly a country-by-country regulatory issue becomes a portfolio-level engineering reality. A five-market international expansion already carries a 98.1% modeled probability of including fiscalization and a 74.8% probability of including hardware-involved fiscal control, while a ten-market footprint has a 91.6% probability of confronting both software-led and hardware-involved regimes. Even if the exact probabilities change when market selection is weighted by commercial considerations, the underlying lesson remains that multinational retail architecture must accommodate materially different definitions of the legally valid transaction.
The next competitive advantage for POS vendors is unlikely to come from adding one more country-specific receipt format. It will come from making compliance a reusable, testable, observable, and continuously maintained capability, while allowing retailers to expand without rebuilding their commercial transaction systems each time a national fiscal authority changes the rules. The world is not converging on one technical fiscalization standard, but global retailers can still converge on a more disciplined way of dealing with many of them.
Research source and calculation notes
Primary source: Darko Pavić, The Global Fiscalization Atlas 2026: How 197 Markets Are Rewiring the Retail Transaction, version 1.0 (July 2026), especially the executive summary (pp. 16–17), methodology (p. 19), fiscal architecture (pp. 29–34), technical signals (pp. 37–38), regional analysis (pp. 26–27 and 57–60), Appendix A (pp. 68–69), and Appendix B (pp. 70–76). The probabilities, expectations, regional scenarios, high-complexity cross-tabulation, and four-architecture portfolio model presented here are new calculations derived from the Atlas counts rather than previously published statistics in the Atlas itself.
Method: all at-least-one probabilities use the finite-population hypergeometric complement, with market selection without replacement. Joint exposure to software-led and hardware-involved architectures uses inclusion–exclusion. Expected counts use linearity of expectation, E[X] = nK/197. Regional calculations replace the global population and category totals with the corresponding regional counts. Values are rounded to one decimal place unless additional precision materially improves interpretation; totals may not sum because of overlapping features or rounding.
Editorial note: This is comparative statistical research, not country-level legal advice. Changes to law or administrative guidance after the Atlas’s July 2026 snapshot are not incorporated in these historical calculations. The complete normalized country data and methodology remain the authoritative reference for reproducing and updating the model.
